• Skip to content
  • +1-312-477-7313
  • [email protected]
  • Facebook
  • Twitter
  • LinkedIn
  • Monetize Data
  • Buy Audiences
Complementics

Header Right

  • Home
  • Data Monetization
    • Data Monetization Program
    • SDK Solutions
  • Mobile Audiences
    • Mobile Audiences Products
    • Location Analytics Solutions
    • Mobile Audiences Examples
  • FAQ
  • Contact

Uncategorized

February 12, 2019 by Walter Harrison

We located the right suburb for a Mobile Audiences deep dive: the suburb of Naperville, Illinois, just west of Chicago. The town features a sprawling outdoor history museum that depicts life in Naperville’s early days, but with a population of almost 150,000, it’s a thoroughly modern city. In Naperville, the median age is 35 and a median family income is $127,5541. The town has a vibrant Main Street shopping area as well as a commercial district with major big-box retailers. These are stats we love to look into, so we decided to study Naperville for two weeks to discover what kind of audiences can be found there.

Mobile Audiences Data in Naperville

mobile audiences device activity graphic of data on me v women naperville study - Complementics
Male vs Female – device activity by gender in our Naperville Mobile Audiences Study.

The video above shows activity on mobile devices during a two-week period in Q4 of 2018 in Naperville. Complementics engineers geofenced the shopping district to observe mobile device activity throughout the time period. What did we see?

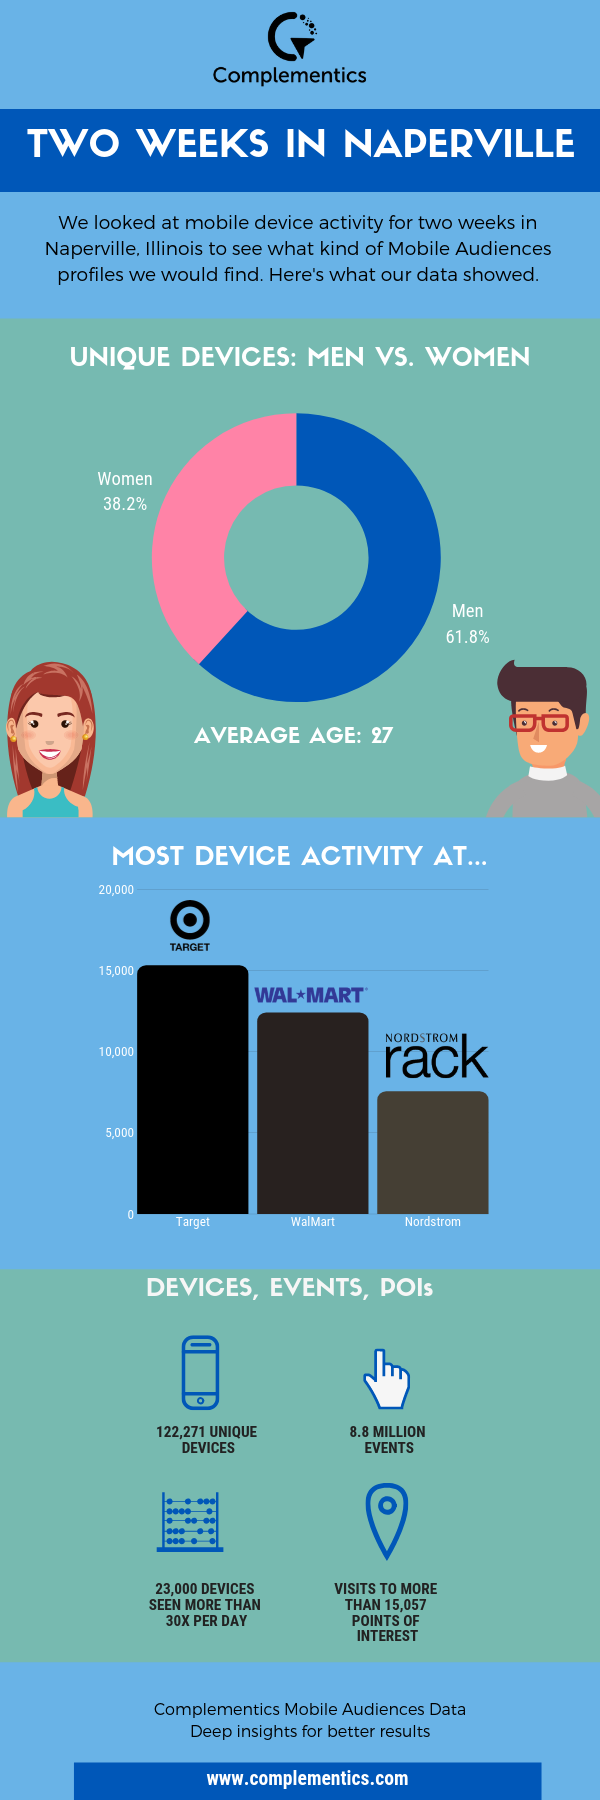
  • Activity on 122,271 unique devices and more than 8.8 million events 
  • Average of 23,000 devices seen on average 30 times per day
  • Visits to more than 15,057 Points of Interest (POIs) in Naperville – an average of 237,331 visits per day
  • Retail traffic was booming – Target had 15,314 events, WalMart saw 12,401 and Nordstrom clocked in at 7,556
  • The average age was 27 years old
  • There were more men than women active – 61.74% men vs 38.2% women

Rich Data for Deep Study

With access to more than a billion devices globally, we can look at almost any POI on the globe to deliver specifics such as mobile device type, age, gender, and more. On average, we can track more than 53 billion events per day from more than 74,979,500 unique devices globally. 

We deliver data to our clients at agencies, publishing firms,brands, hedge funds, and more so they can get the rich insights.

Our clients use this data to:

  • Refine audiences for ad targeting
  • Deliver better search results to site visitors
  • Make smarter decisions about future investments
  • Drive visitors to the right content
  • Understand brand activity and affinity
  • Augment brand loyalty data
  • Push the right content to the right person at the right time

Data at Scale

mobile audiences device activity infographic for naperville data study
Devices and events activity recorded during a two-week study of Naperville, Illinois

Looking at two weeks in one midwestern suburb delivers a lot of data. Imagine what you could do with this kind of data at scale. Peer into activity at points of interest across a city – or across the globe, dig into activity to see which demographic is visiting your retail locations, or find out if traffic is increasing because of in-market ad campaigns you’ve placed.

Find out more about our data, location services, audiences platforms and more. Visit our location data page, or get in touch with us for more information.


1 City of Naperville statistics, https://www.naperville.il.us/about-naperville/demographics-and-key-facts/

** Please note: Complementics data is representative of data accrued by Complementics and its data partners.


Filed Under: Uncategorized Tagged With: data insights, data study, mobile audiences

April 26, 2018 by Miriam Carey

Brands and agencies use anonymized location data to make better business decisions. From pulling data on a single point of interest (POI) to study and learn about customer behavior, to looking into POIs across an entire country to develop a better understanding of trends, location data derived from mobile phone usage can be a valuable tool. Here are some of the ways our clients have been using location data options.

Location Data for the Restaurant/Hospitality Industry

men in casinoGaming and Hotel Loyalty: One client recently looked at all the Las Vegas visitors who were members of their loyalty program to answer location-based questions such as, How far did visitors travel to get to Las Vegas? Where did they go while they were here? Which of my competitors’ locations did they visit? How long was their stay?

By learning more about their customers, they could better serve offers and deals at moments when those offers, and deals were likely to have the most impact. This kind of targeting lifted engagement and spend

Restaurant Locations – How far are people traveling to get to a restaurant, particularly restaurants that rely on repeat customers? Answering this question helped an agency make smarter ad buys on behalf of a restaurant chain, optimizing spend where digital, print, and broadcast ads would have the most potential to reach customers within the restaurant’s “drive zone” in each market.

Who is Walking Into Your Restaurants: We can provide data on the demographics of people entering a restaurant such as age, race, sex, income, and more, to help restaurants make smarter decisions about what kind of food or drinks to serve, specials to run, and audiences to reach out to.

Deterministic Location Data for Financial Services

Tracking Potential Disaster: When a fast food chain got hit with bad news, we were able to look at all the chain’s stores across the country to see if footfall was increasing or decreasing immediately after the scare. Our client, a hedge fund, was able to make a more informed decision – rather than following his gut.

Check on Footfall at Branch Locations: One bank conducted a study on footfall traffic at each of its branch locations to gain insights on how busy each branch location was and how patterns differed by time of day or day of week. With this data, they were able to make smarter decisions about staffing, operational hours, and even parking lot design.

Luxury Brands Leverage Confirmed Visits and Location Data

Check up on the Competition: One client, a luxury brand, wanted to know where their customers tended to go when they weren’t at their locations. Studying trends market-by-market helped the brand keep an eye on their competition to see where else shoppers were going. The result was not only a deeper understanding of the competition, but the brand was able to create richer affinity programs with neighborhood hotels, restaurants, and attractions to drive additional traffic to their locations.

Improve Marketing Automation with Location Data

Know your Customer: Make the most of your CRM. We help many of our clients make deterministic and/or probabilistic matches between email addresses and mobile device IDs. This helps marketers better leverage their own database to target specific customers on social media, or to get better results from CRM health and usefulness.

Trigger Location-Specific Promotions: There is no better time to remind a customer of a promotion than when they’re walking into – or near – your store. We work with agencies and brands to deliver location data that helps them target customers in this way.

Smarter Billboards: Studying information on traffic patterns for a specific stretch of road helps agencies who work with digital and print billboard advertising target locations for messaging.

Retail

When paired with foot traffic data, Google Floor Plan maps like this one provide valuable insight.

Optimizing Store Layout: Retailers who can provide us with floor maps of their store layout can request information about how visitors travel through aisles or sections of a store. They examine traffic patterns, look for cold spots, and conduct A/B testing on best layout options to optimize customer experience and sales.

Target the Right Demographic: See traffic patterns in key demographic areas and understand how a neighborhood location is most likely to have the signal density you’re looking for in a city.

Confirmed Visits: Location data such as confirmed visits can bring more clarity to a dataset. Know when a visitor not only walked by a location, and if they walked in or checked in.

Auto Dealers

Visualize Path-to-Purchase: When auto dealers gain insight into buyer intent, they can “drive” sales more effectively (sorry, we couldn’t resist.) With our location tools, they can gain insights on which lots customers are visiting in a regional area, and drill down into that data to see which area of the lot customers are spending time in to know which car brands are capturing the customer’s attention.


These are just a few of the ways our clients use data to gain insight, save money, drive sales, please customers, or broaden their business. Learn more about our location data and get creative – we never run out of ideas.

Find out more about our location data offering.

Filed Under: Uncategorized Tagged With: data for brands

November 28, 2017 by Miriam Carey

For publishers, ad blocking represents the ongoing dance between revenue and user experience. According to IoT for All, that dance may move in a new direction: A.I. ad-blockers that identify ads according to their FTC-mandated signifiers.

Your personal experience of online ads depends heavily on the type and topics of media you consume. If you’ve never played a shoddy iPhone game or accidentally lost yourself in a clickbait farm, perhaps you’ve never seen those low-quality ads that are clumsy at best and deceptive at worst. What do I mean by low-quality? Here are a couple of the programmatic sins that drive millennials to pick up ad-blockers.

Torn seams

The average consumer has no idea how many moving parts a video ad entails. They just see a 30-second spot about deodorant. Poor media software or other structural errors can result in improper formatting, slow loading, and other tears in the seams. Viewers expect a smooth transition; having to sit through an ad longer because the ad is broken is a great way to sour user experience.

Déjà vu

Programmatic advertising is a godsend when working with high-volume inventory. However, when marketers aren’t careful in their delivery parameters, strange and annoying things can happen, like repeating the same video for the same customer over and over. Or repeating the same video for the same customer over and over. Or repeating the same video for…

Where’s the eXit?

This one’s especially egregious because it exploits users that don’t know any better. Since certain ad formats include a “skip” or “close” button, some of the more unscrupulous creatives will feature misleading visuals–like a pronounced “X” in a company logo–that fool inattentive consumers into a time-consuming click.

Thanks to infractions like these, the battle of the blockers is going to last us awhile. That’s why publishers need to consider alternate revenue sources, like monetizing their data. The Complementics Data Exchange helps publishers do just that: by installing a bit of code on site, publishers can sell anonymous behavioral data. Best of all, companies use this data to actually improve users’ experiences, instead of perpetuating a race to the bottom.

How Content Classification Adds Value to Mobile Data

If you spend some time on our new site, you’ll probably see a few mentions of our sister company, eContext. Why are we so proud of this partnership? It’s because Complementics takes already valuable Mobile Audience Data and enriches it via eContext to add an extra layer of understanding.

That probably sounds buzzwordy, so let me explain: eContext is a classification system that labels content according to 500,000 (very specific) topics. Those topics are organized into and taxonomy of 25 verticals and 20 tiers of depth. What does that mean? eContext’s structured labelling helps us group and interpret ambiguous content.

For example, suppose you have access to Audiences’ app usage. eContext can go beyond app store categories to get a granular understanding of users’ interests. Then, when you combine that structured, specific intelligence on app use with other dimensions of Complementics data, you end up with a hostile customer profile that reveals spending power, interests, and even brand loyalty.

Complementics Mobile Audiences marries empirical audience data–clear-cut items like location and demographics–with the kind of personal-preference information that’s notoriously tough to pin down. It’s that second half that relies on eContext, adding a deep understanding of content to a huge network of behavioral data.

Filed Under: Uncategorized

October 24, 2017 by Patrick DeLoach

Recently, a client reported to us that they saw an uptick of in-app purchases after using our enriched  mobile data to tweak their campaigns. We’re proud of the results of course, but the study is also helpful because it underscores some key advice: when processing unstructured data for consumer insights, make sure you’re starting with questions that correspond to your goals.

Mobile Data Demystified

In this case, the client came to us with partially-interpreted mobile data: they knew their customers showed an interest in gaming apps, but lacked the classification structure to identify trends in non-gaming app behavior. Since their goal was to focus marketing and promotions more directly to their customer’s interests, the question became: what other interests do these customers demonstrate? After all, “gaming’ is a broad term these days; you might not want to drop a Candy Crush player into the same box as a Grand Theft Auto pro.

So, to answer the client’s question, we ran their data through a topic classification system with 21 verticals and 500,000 total categories. Then, after each datapoint was classified as precisely as possible, we zoomed out the map from specific niche to general interest and found distinctive trends for health and fitness, dating, finance, and others. That gave us a much clearer behavioral picture than simply “gamer”. (For more information about topic classification, check out our sister company, eContext.)

How can classification help your mobile data strategy?

With goal-driven, professional enrichment, unstructured consumer data can offer an unvarnished look at your customer base. But before you go digging, it helps to know as clearly as possible what it is you’re digging for.

Learn more: Check out our mobile audiences products, or read a recent blog about our mobile audience network.

__

And, of course, you can always contact us with questions.


Filed Under: Uncategorized Tagged With: data classification, mobile data, segmented data

August 11, 2017 by Patrick DeLoach

We’ve got a new look and feel at Complementics, powered by huge growth and demand for our Mobile Audiences Network. Let me give you a tour.

Our Mobile Audience Network

Complementics is all about mobile data. We’ve grown over the last few years and we’re now managing data from more than 500M devices globally, with a focus on North America, Latin America, Western Europe and APAC.

We’ve also expanded our data offering to include advanced Geofencing and International Audience insights. Our geofencing has been a used by financial services firms who are looking to get a jump on the competition, and by smart marketers in the travel industry who are looking to discover more about what people are doing when they’re visiting.

The result: better investments all around. Financial services people can get the research backup they need for important decisions, and travel professionals are now able to target their audiences more accurately, delivering ads and incentives that boost spend and engagement.

There are many reasons to buy our data – for one thing, we’ve got a lot of data, and or base of 500M devices is growing constantly. We’ve also got deep, enriched data.

One big advantage we pass on to customers comes from our sister company, eContext, the world’s largest semantic text classification engine, which helps us enrich data and deliver classification to 20 tiers.

Check out our Mobile Audiences Network to learn more about data we have for sale.

Results, results, results

In addition to all that mobile data, we also have offline information on more than 110 million U.S. households. This means we can provide deterministic matching with great detail so that you can have more meaningful results no matter what kind of data you’re looking for.

Incremental revenue made easy

The truth is, publishers love us too. We make it really, easy for publishers to anonymize and share data, helping them to create incremental revenue on the traffic they work so hard to get.

We recently introduced the Complementics SDK for publishers that makes participating in our program even easier. How easy? Check out our SDK page to find out.

Whether you’re buying, selling, or looking to enrich your own data, Complementics has a solution that will work for you. We’re happy to work with you on a solution that’s tailored to your needs – check out the site and give us call.


Filed Under: Uncategorized

  • Page 1
  • Page 2
  • Next Page »

Pre Footer

In a few short minutes, we can introduce
you to the Complementics Data Monetization program

App publishers: Let’s talk about what Complementics Data Monetization can do for you.

Contact us ›

Footer 1

complementics logo

Copyright 2024 Complementics
All Rights Reserved | Privacy | GDPR | Do Not Sell

  • Facebook
  • Twitter
  • LinkedIn

Footer 2

Chicago

1074 West Taylor Street
Suite 371
Chicago, IL 60654
United States
+1-312-477-7313

Footer 3

London

167-169 Great Portland Street
Floor 5
London
W1W 5PF
United Kingdom
+44 (0)20 7834 5000

Footer 4

Enquiries

[email protected]